
In the mortgage industry, there’s no shortage of paperwork — but very little insight. Branch Managers, Loan Officer and Loan processors spend hours reviewing Closing Disclosures and pricing sheets, hunting for key details like loan amounts, pricing, and lender credits. As a Business Intelligence Analyst with a background in post-closing mortgage review, I use Tableau to turn these documents into clear, actionable dashboards — saving time, reducing errors, and making reporting a breeze.
One of the biggest frustrations I saw in the mortgage world — and the reason I started collecting Closing Disclosures, URLA’s (1003) pricing data myself — is what happens when a branch moves to a new lender. Most loan officers don’t realize that once they leave a company, they lose access to everything they’ve done: the client records, the pricing history, the loan terms — all of it. The data belongs to the lender, not the individual or branch. That makes it nearly impossible to analyze past performance, maintain relationships for a refinance or next purchase, or even know what kind of deals you were consistently closing.
So I decided to do something about it.
How I Built My Workflow and Took Back Control
Once I realized I couldn’t rely on lenders to keep a record of my own work, I started gathering the key documents myself — one file at a time. My goal was to collect enough information to analyze loan performance, understand my pricing history, and keep client contacts for future reference.
Here’s how I do it:
- URLA (1003): This form is my starting point. It gives me the borrower’s contact information, which is critical if I ever want to follow up or reconnect in the future.
- Closing Disclosure (CD): The CD is a goldmine. From this, I extract the loan type (FHA, Conv, etc.), loan amount, interest rate, and the official closing date. This helps me track what kinds of loans I was closing — and when.
- Purchase Advice or Lock Confirmation: This document gives me the actual pricing. It tells me what the lender paid for the loan, which lets me understand profitability and compare deals across lenders.
- Other Docs (Note, Homeowners Insurance, Condo Docs): When working with refinances, these additional documents can provide important details about property type, insurance costs, and loan terms — giving me the full picture when needed.
I enter this data into a spreadsheet or CSV format and load it into Tableau, where I can easily slice it by month, lender, loan type, or even interest rate bands. Over time, it turns into a personal loan portfolio — a historical record that’s fully mine, not locked behind a lender’s system.
What My Tableau Dashboard Shows Me
With the data I collect from each loan, I’ve built a Tableau dashboard that helps me understand exactly what kind of business I’ve done — even after switching lenders. It lets me track performance, spot trends, and make smarter decisions.
🔍 Here’s a live look at one of my dashboards:
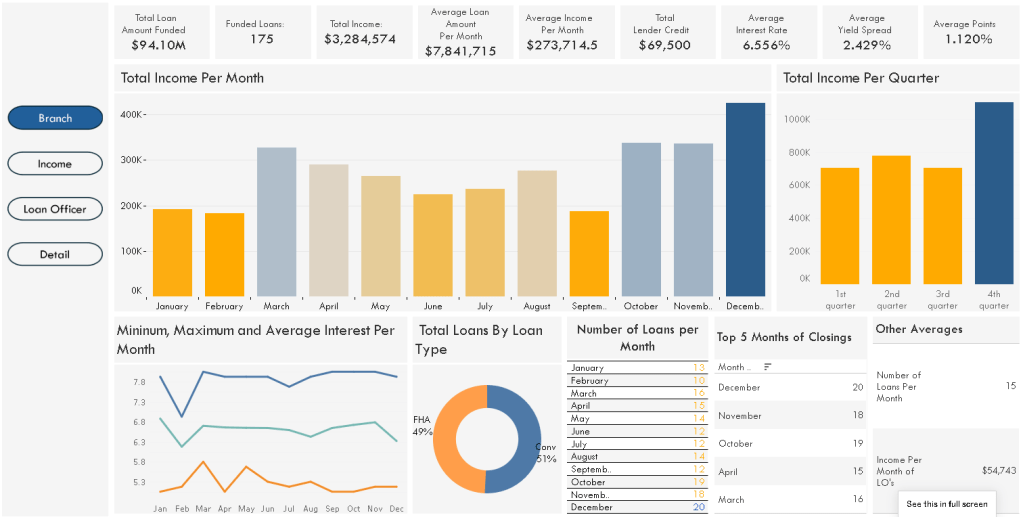
Whether I’m reviewing refinance volume, comparing lenders, or seeing which months brought in the most business, this dashboard gives me instant insight — and it’s 100% mine.
Wrap-Up & Call to Action
Building my own loan data dashboard changed the way I work — no more guessing, no more lost deals, and total control over my mortgage business history. If you’re in the mortgage industry and tired of losing your data when switching companies, I encourage you to start collecting your own files and using tools like Tableau to gain clarity and power over your numbers.
Want to set up a similar dashboard or have a fully customized mortgage data solution? Feel free to reach out — I’m here to help other mortgage professionals take back control of their business.
About Me
Hi, I’m Stephen J. Martins, also known as The Loan Data Guy. With nearly a decade of experience in the mortgage industry, I specialize in turning complex loan documents into clear, actionable insights using tools like Tableau. My passion is helping loan officers, brokers, and mortgage professionals gain control over their data, improve reporting, and make smarter business decisions — no matter what lender they work with.
When I’m not diving into mortgage numbers, you’ll find me exploring new data tools or sharing tips on improving mortgage analytics. Feel free to connect with me anytime!
